The information from the questionnaires evaluates a patient’s symptoms and concerns in areas that had either not been considered or had been hard to measure before. This new information showed how people were doing using measurable data like numbers and percentages. The study also used qualitative methods (surveys, interviews, and focus groups) to tell us about how different groups felt about the information and how they used it. Here are some of the findings from the study and what the results mean.


Key Points
- From September 2012 – November 2014, 177 patients with RA enrolled and completed the questionnaire.
- PROMIS showed that people with RA had much higher levels of symptoms and impacts from their condition than the normal US population.
- PROMIS results supported what RA patients had been saying: levels of pain were high and function were affected. But PROMIS showed that fatigue, interference with sleep, and impact on participation were also bad, especially when RA was active.
- PROMIS showed that RA patients were still having a lot of symptoms even when the measures that doctors used would classify them as being in low disease activity or remission.
- Patients and doctors thought that the information helped them get a more complete idea of how RA was affecting someone and what symptoms needed to be looked at in more detail.
- Patients and doctors thought that having this information helped them communicate better about RA.
Who Participated in the Study?
From September 2012 – November 2014:
- 177 patients enrolled and completed the PROMIS questionnaire.
- 82 percent of patients were female.
- 83 percent of patients were white.
- The average age was 56 years old.
- 24 percent of patients had a high school education or less.
The length of time for patients having their RA was 0-41 years; 29 percent had RA for less than or equal to 5 years, and 13 percent had RA for less than or equal to 2 years. Thirty two percent of the RA patients were in remission, while 38 percent were classified as having low disease activity.
The patients who participated each had their own treatment plan and medications. Most patients (89%) were taking oral traditional disease-modifying antirheumatic drugs (DMARDS) like methotrexate, sulfasalazine, and hydroxychloroquine. Nearly half of the patients (49%) were receiving treatment with a biological medication (DMARDs that are given as injections or infusions).
What Did the Data Tell Us?
To determine what PROMIS could tell us about the level of symptoms people with RA were having, we looked at what the mean or average results for scores were in our patients and the range of scores for our patients. We also looked at how these measures varied in RA patients with different levels of disease activity, these data were reported in a research publication.
It is important to understand how PROMIS results are given to be able to interpret the results. PROMIS uses a T-score system, which is based on establishing an average (mean), then comparing specific results against the average.
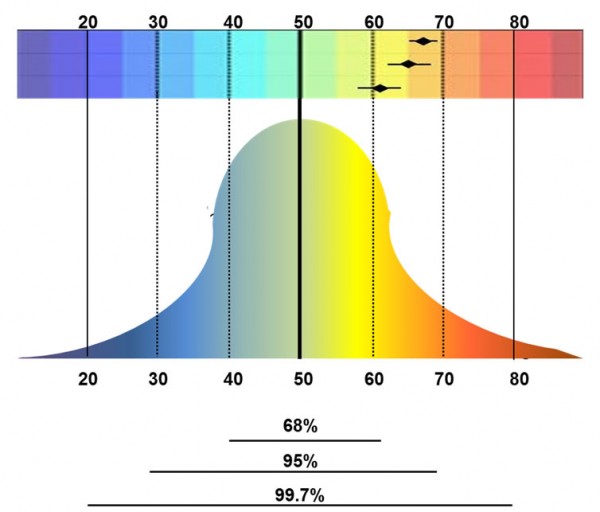
For each one of the measures, the “average” for the entire United States population is 50. Scores that are less than 50 are better than the national average and scores over 50 are worse than the national average. 68% of the population will fall between scores of 40-60. For example, if the national average of people reporting fatigue is 50, and your test results indicated you have a score of 45, your results would be slightly better than the national average. Now, if you were to have a score of 65, that means your fatigue is worse than what is normal for the US population, and that you fell into the highest (worst) 15% of the entire population.
The PROMIS system was able show a range of information related to a certain symptom from the very best to the very worse. In physical function, for example, PROMIS scores could identify someone who could run a marathon, to someone who had trouble walking up stairs, to someone who could not walk at all. The results from PROMIS gave a more accurate picture than current measures of how symptoms were affecting patients.
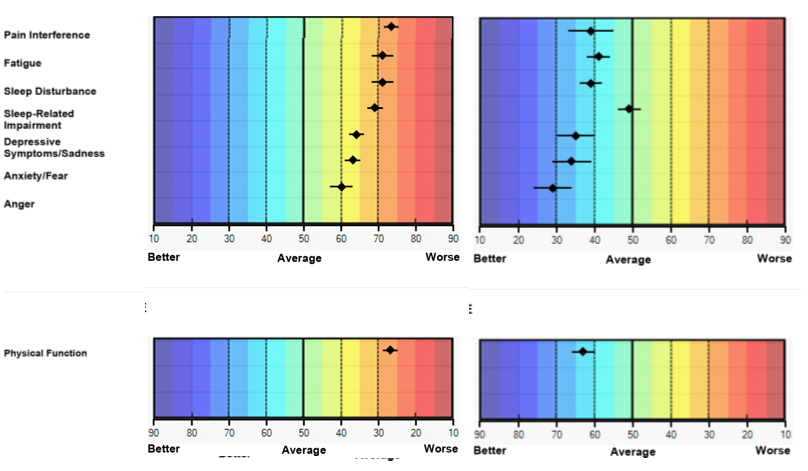
Here is an example of a PROMIS report for a patient when her arthritis was very active and when she went into remission. These graphs show different colors with “good” on the left in shades of blue, and “poor” on the right in orange and yellow. In the first graph on the left, all her scores are 60 or higher (including things like feeling depressed, anxious, and angry). In some cases her score were over 70 (the worst 2.5% for the entire US population) for pain, fatigue, sleep problems. For physical function the numbers are reversed, but the color coding is still the same, she has very bad physical function. On the right side is the same patient when her arthritis came under control with medications. She is now better than the population average for every area we asked questions about. In fact, when she was in remission she was able to get back to where she was before she got RA: she could run a half-marathon! These graphs show how powerful these PROMIS measures can be. They show where someone is in comparison to the population, they show how symptoms change over time, and they show how many different areas of health can be affected by a condition.
We also found that the level of symptoms increased with higher levels of RA inflammatory disease activity. But even when people were in “low disease activity” according to the measures doctors use to guide treatment, PROMIS measures showed that things like pain, fatigue, and function were still much higher on average than the general population.
Why Should I Care About These Results?
You may be wondering why these ranges are important and what they mean for you. With advances in medications and treatments for people living with RA, it is more and more likely that patients will be doing well using the ways of evaluating disease that doctors are currently using. However, even if you are doing well, you may still be dealing with a few everyday symptoms that older disease measures may not identify. PROMIS can help physicians learn more about all the different ways that life is affected by RA. They can then use this to help tailor treatments, or capture any new changes – whether big or small – that impact your health-related quality of living. These results provide important data to estimate function, and the intensity and impact of symptoms that are important to patients.
Along with seeing the impact of the study through data, patients, doctors, and research staff described the impact of the PCORI pilot study. Through one on one interviews with each group we gathered information about how this study affected overall health care for patients, if it was able to take place in a busy clinical setting, and if it changed communication between patient and provider.
How Did PROMIS Work in a Busy Clinical Setting?
One of the goals with this study was to see if PROMIS could be used in the clinic without adding too much time to the patient’s visit, and to make sure patients could use the tablets. Through the study patients provided feedback about their experience. Early on, some patients told us that they had trouble using the touch screen with their fingers because their fingers were bent from the arthritis. They told us that having a stylus with a large barrel would help them use the tablet better. When we learned about this, we got the styluses, and the patients thought this was very helpful. Overall, patients enjoyed using the tablet, with many noting they liked it more than the regular health assessment questionnaires on paper.
The research team also wanted to know what doctors thought about getting this information. Would collecting and reviewing questionnaire results with patients slow down the clinic?
Overall Effects on Provider and Patient Communication
While it is important to discover if PROMIS could be effectively used in a busy clinical setting, determining the best questions to ask during a patient visit was more important. Did the patient have a more meaningful conversation with their doctor?
Conversations with patients, doctors and research staff showed that most felt there was already open communication between patient and provider. However, it was a helpful reminder of what to discuss, and the study brought up a number of issues patients didn’t think would be related to their disease but actually were. Even though patients thought they were already receiving good care, both patient and provider did not realize some of the ways RA was affecting them. The study helped patients provide their physicians a glimpse into their daily experience living with a rheumatic disease.
This study also helped doctors learn more about different symptoms their patients experienced that they did not ask about before. For example, if a patient didn’t discuss how RA was affecting their sleep, it wasn’t a main topic of conversation. The PROMIS scores also guided doctors to ask about things that were not always a topic of conversation during a visit, or may not have been caught using normal instruments, like depression. One doctor was able to refer her patient to a psychologist using the results from the PROMIS score.
Many people with arthritis have gotten used to being in pain and do not complain a lot. They keep a “stiff upper lip”. But when patients saw their results, they could see better how much their conditions were really affecting them. For example, a patient may have rated his pain on the usual scale as being 1 or 2 out of 10. But using the PROMIS measures that asked about how pain was impacting his life, his scores showed that he was at 60. This showed him and his doctor that he had been “living with” a lot and not talking about it. Doctors gave us examples like this that some showed how patients were not doing as well as they wanted their physician to think. This opened up better communication and discussions.
Doctors did not use the questionnaire results alone to make clinical decisions, but doctors did think that this information helped give them a better “whole picture” about their patients. Doctors also told us that by seeing these questionnaire results, it helped them to better ask questions about symptoms they had not considered before. The doctors also thought that being able to follow scores over time helped them to ask better questions.
Using the PROMIS instruments and results did not only help the provider in their care, it also helped the patients discover more about themselves and how they were living with their disease.
ACKNOWLEDGEMENTS AND DISCLAIMERS: The research project described was funded through a Pilot Project Award (IP2-PI0000737) from the Patient Centered Outcomes Research Institute (PCORI) awarded to Dr. Clifton Bingham. Funding to enable the development of material concerning this project was provided in part through a Eugene Washington PCORI Engagement Award (EAIN-1988). This work described has also been supported through the Rheumatic Diseases Research Core Center funded by the National Institutes of Health (NIH) and the National Institute of Arthritis, Musculoskeletal, and Skin Diseases (NIAMS) (P30-AR053503), the Ira Fine Discovery Fund, the Don and Dorothy Stabler Foundation, and the Camille Julia Morgan Arthritis Research and Education Fund. All statements on this website, including its findings and conclusions, are solely those of the authors and do not necessarily represent the views of PCORI, its Board of Governors, or Methodology Committee, or of NIAMS or NIH. We thank the patients, staff, and physicians for their participation in this study as well as our external stakeholders and advisors. Special thanks to CreakyJoints® (www.CreakyJoints.org) for their time and support for this project and the engagement of an activated online community of people living with arthritis.